| Sources of epidemiological data to inform health policy and manage programs | |||
|---|---|---|---|
| Definition | Use | Comments | |
| Public health surveillance | Continual systematic monitoring of the occurrence of disease/condition in a population using data from different sources. | Provides managers with ongoing data of the occurrence and distribution of conditions; can provide real-time warning of when and where an outbreak will occur. | Requires rapid and efficient long-term collaboration to collect and analyse data across health and other sectors |
| Disease registries | Legally mandated systematic registration, in a geographic area, of all individuals who contract a specific chronic disease, with longitudinal follow-up of all relevant events related to each individual. | Offers detailed information on the incidence and duration, treatment and outcomes of a disease to advise prevention and control policies and programmes. | Expensive and difficult to follow-up cases especially in low-income countries; requires efficient long-term collaboration across health facilities and multiple professionals to collect and analyse data. |
| Health facility records of health events | Continuous systematic, reporting of the occurrences of health events and mandatory reporting of notifiable diseases. | Assists public health departments to plan disease control and prevention policies and programs; and contributes to knowledge of global disease patterns. | Requires efficient and rapid information systems; trade-off between number of diseases to notify and reporting workload. |
| Civil registration and vital statistics | Mandatory continuous recording of all births and deaths (and cause) in a population. | Supports planning by providing birth and death rates and causes of death. | Not fully functional in many LIMCs where causes of death are hard to ascertain. |
| Adapted from The Palgrave Handbook of Global Health Data Methods for Policy and Practice | |||
Evidence and Hypothesis-Testing in Epidemiology
Human Health & the Environment
Thu Sep 25, 2025
Human Health & the Environment
Thu Sep 25, 2025
Evidence and Hypothesis-Testing in Epidemiology
What is epidemiology?
The study of patterns, causes, and effects of health and disease conditions in populations.
- Epidemiologists
-
observe health conditions among groups of individuals in populations at risk,
-
offer estimates of the severity of the health condition in the population,
- and identify factors and interventions that health programms can target to prevent and control the condition.
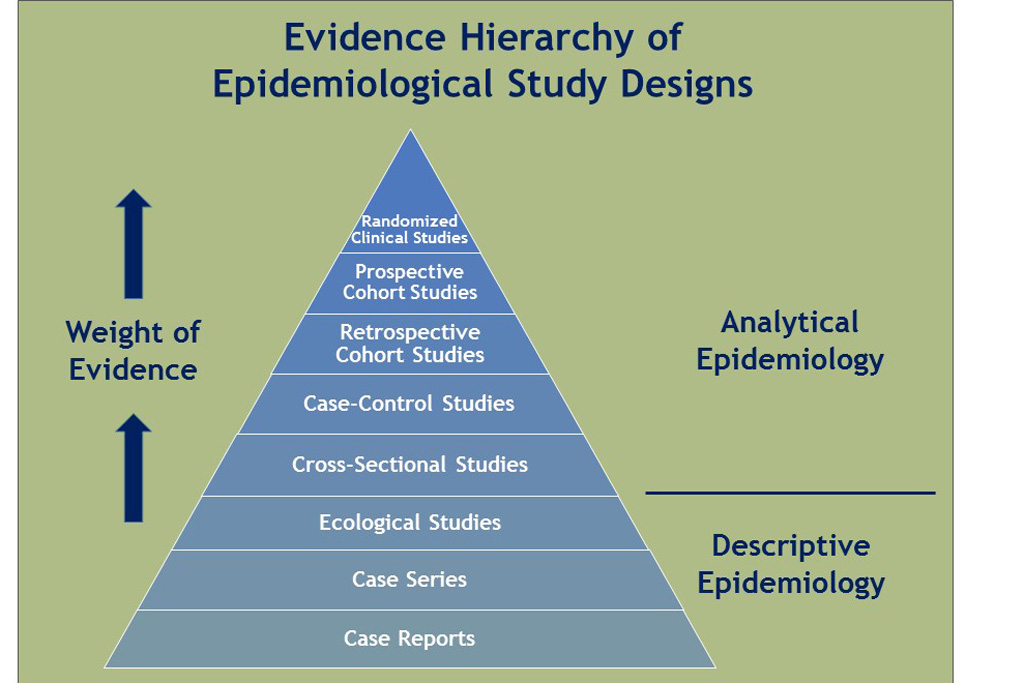
Scale of the Problem
What is the prevalence of a disease/condition, where and among which groups is it prevalent?
Cross-sectional Study
Random samples of individuals in a population at a point in time. 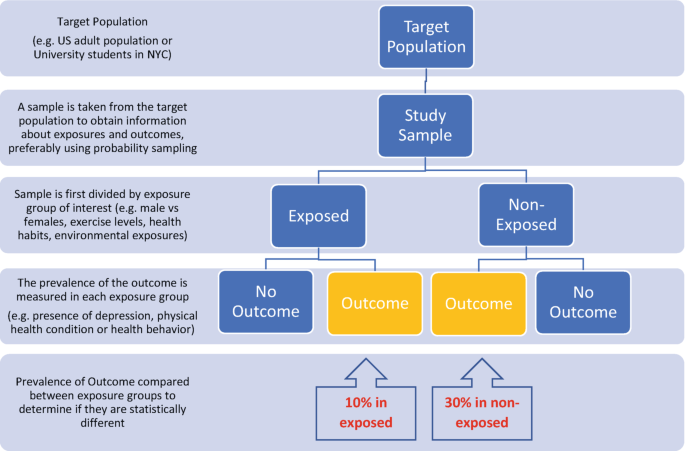
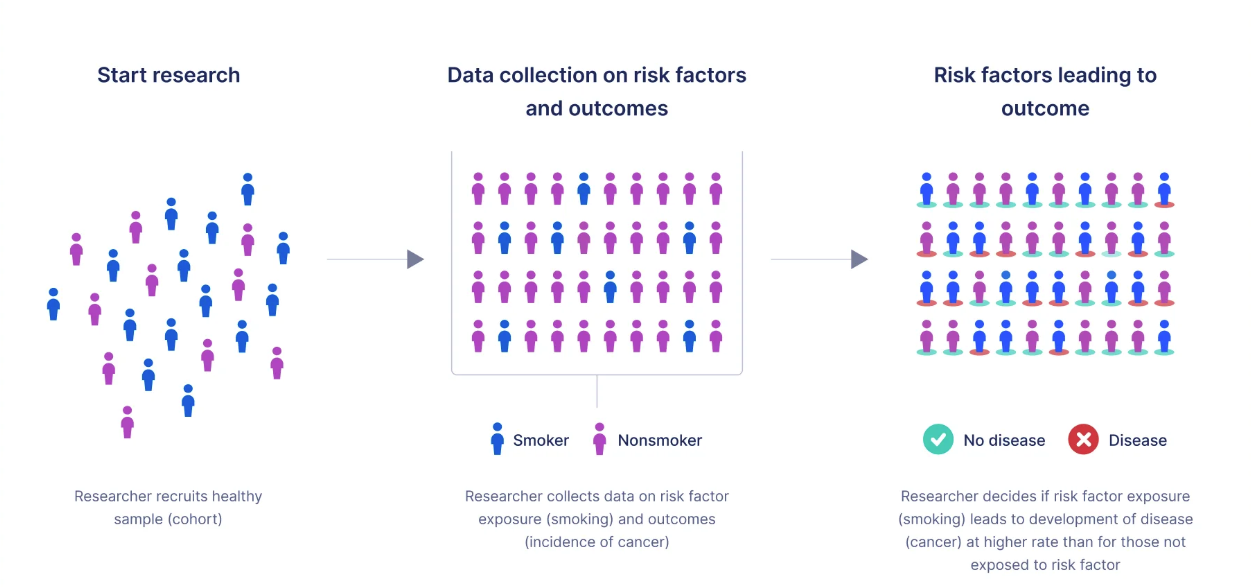
Association of Problem with Risk Factors
Which are the risk groups and factors associated with the disease/condition that an intervention could target?
Cohort (Longitudinal) Study
Follows a well-defined population over time who are exposed to risk factors of interest.
Association of Problem with Risk Factors
Which are the risk groups and factors associated with the disease/condition that an intervention could target?
Case-control (Retrospective) Study
Selects a group of cases with a disease/condition and a group of controls without the condition (but otherwise similar) and records history of exposure to potential risk factors in both groups. 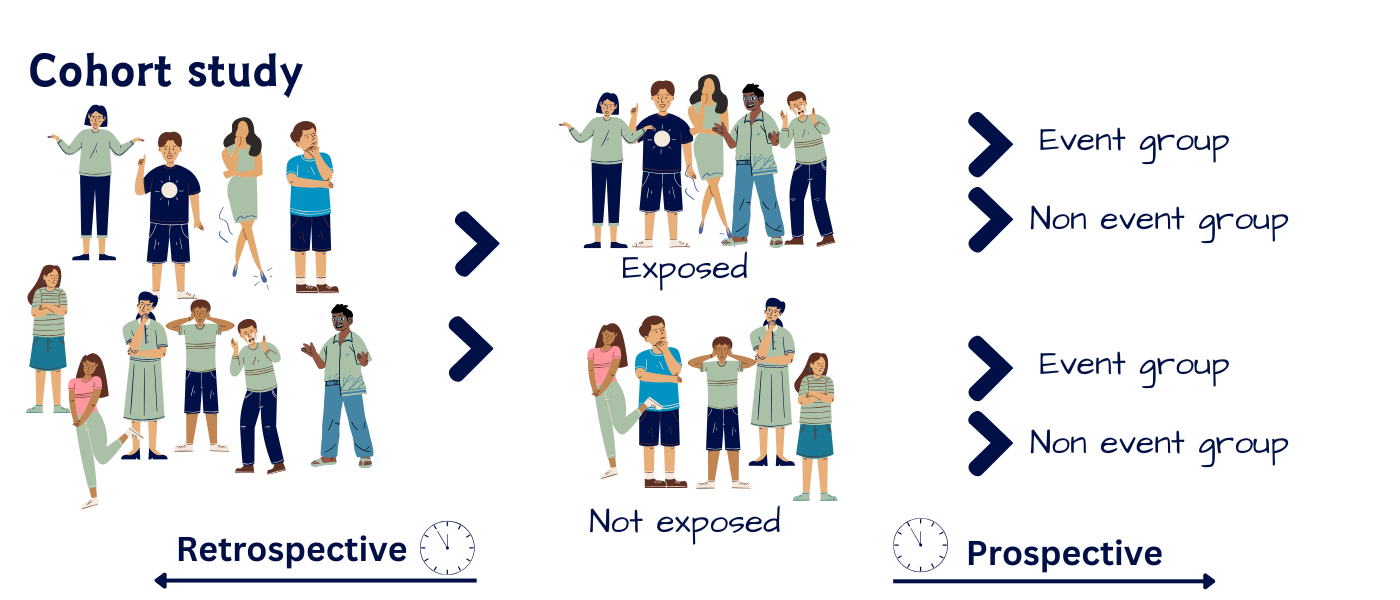
For uncommon outcomes, the OR approximates the RR for an association.
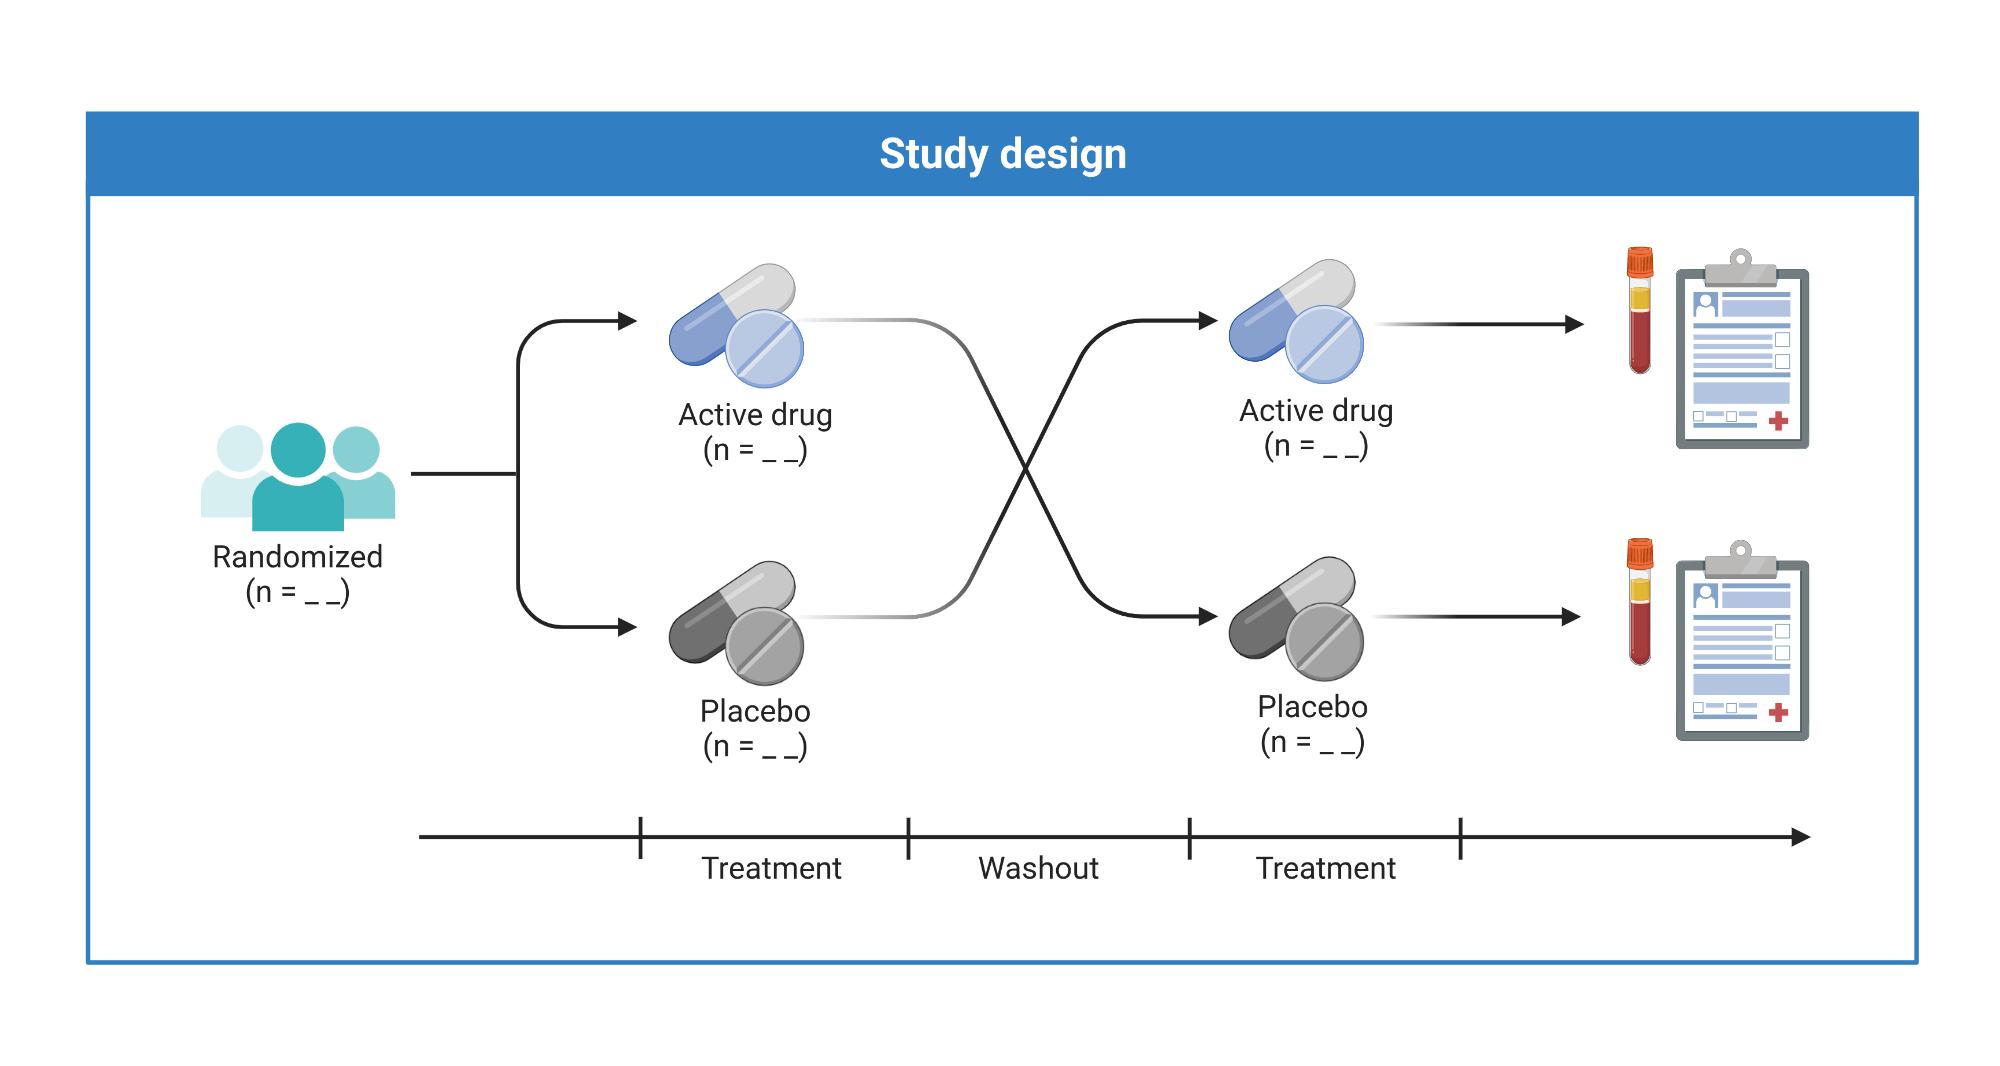
Choice of Treatment or Intervention
Which intervention to recommend?
Randomized Controlled Trial (RCT)
Randomly assigns consenting participants, groups or communities to an experimental treatment, or to a standard treatment, no treatment, or a placebo.
Choice of Treatment or Intervention
Which intervention to recommend?
Quasi-experimental Study Designs
Utilizes control groups which are selected or matched, or statistically simulated, to be as comparable as possible to the subjects exposure to the new intervention.
Research Methods & Ethics
Provides online resources for writing protocols and reporting for most types of epidemiological studies.
Since serious ethical considerations cut through all aspects of design and implementation of studies of people, investigators must gain approval from nationally approved institutional review boards.
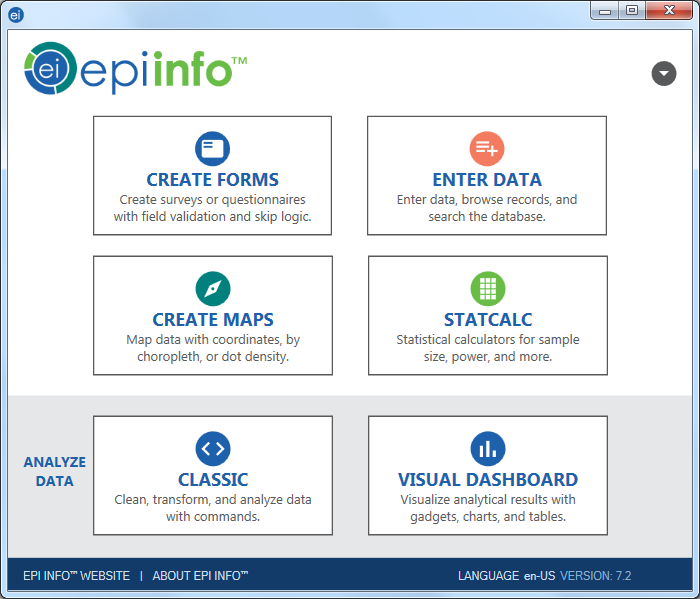
Open source software developed by the CDC to provide customized tools for data entry and analysis, with excellent visualization including maps; it also supports development of small disease surveillance systems.1

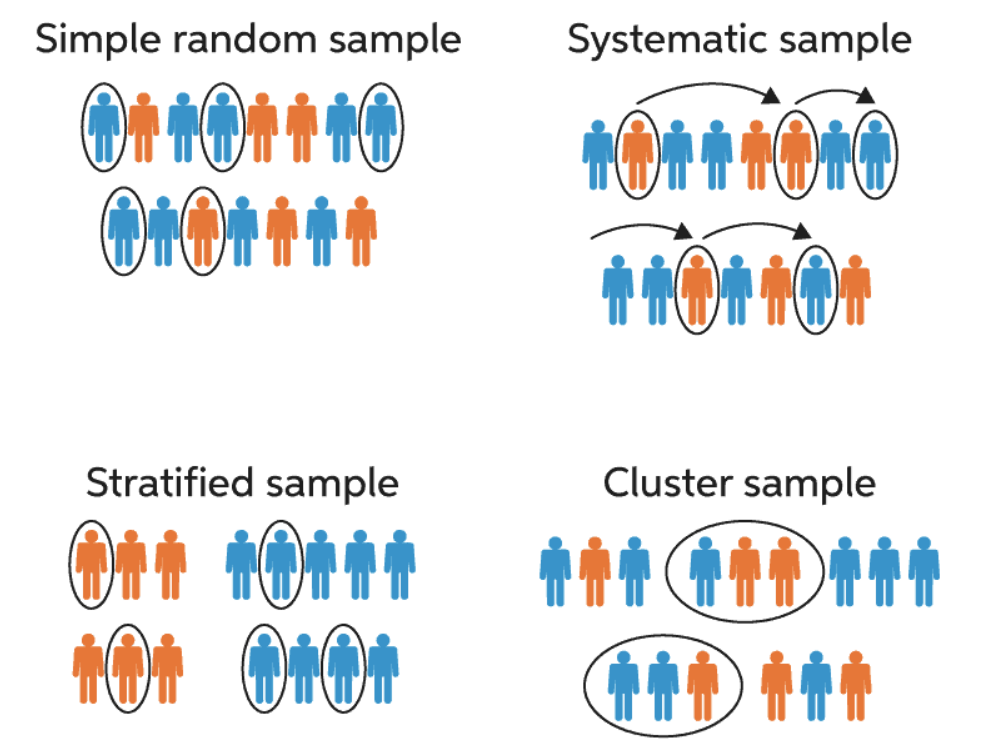
Critical Design Aspects
- Simple random sampling
-
not often feasible or appropriate
- Stratified sampling
-
population is stratified by variables like sex or age
- Random stratified sampling
-
random sampling within strata described above
- Cluster sampling
- investigators sample clusters from a population partitioned into homogeneous groups (or clusters), such as enumeration areas, villages or schools
- Disease status can be ascertained by
- examining participants for symptoms and signs consistent with the disease or event using diagnostic laboratory tests,
- administering questionnaires or conducting interviews,
-
reviewing medical records, sometimes by linking subjects from different administrative or research databases.
- Accuracy requires
- direct laboratory assays for exposure
- careful interviews of cases (or surrogate information from several sources)
-
using standardized questionnaires to minimize recall bias.
- To ensure proper data quality, investigators can
- conduct pilot studies,
- employ laboratory quality assurance
Epi Info1 includes a sample size calculator, which addresses the aim of the study, the type of study and the chosen sampling method.
- The investigator provides
- a margin of error or width of confidence interval they expect to obtain.
- estimated indicator values via literature review or pilot investigation.
The smaller the intended margin of error, the larger the required sample size.
Bias in Results
Bias is the extent to which a study systematically underestimates or overestimates the indicator described or the association reported between exposure and the outcome.
- In cross-sectional studies
-
when sample members do not represent the population to which the investigator hopes to make inference.
- For case-control or cohort studies
-
poor representativeness may not necessarily lead to bias, unless there is differential sample distortion with respect to exposure and outcome.
- In clinical trials
- selection bias arises when there are systematic differences between treatment groups in factors that can influence the study outcomes being measured.
- Occurs through
- errors in recording observations
- participant recall bias
- instrument bias
- misclassification of exposure and disease status
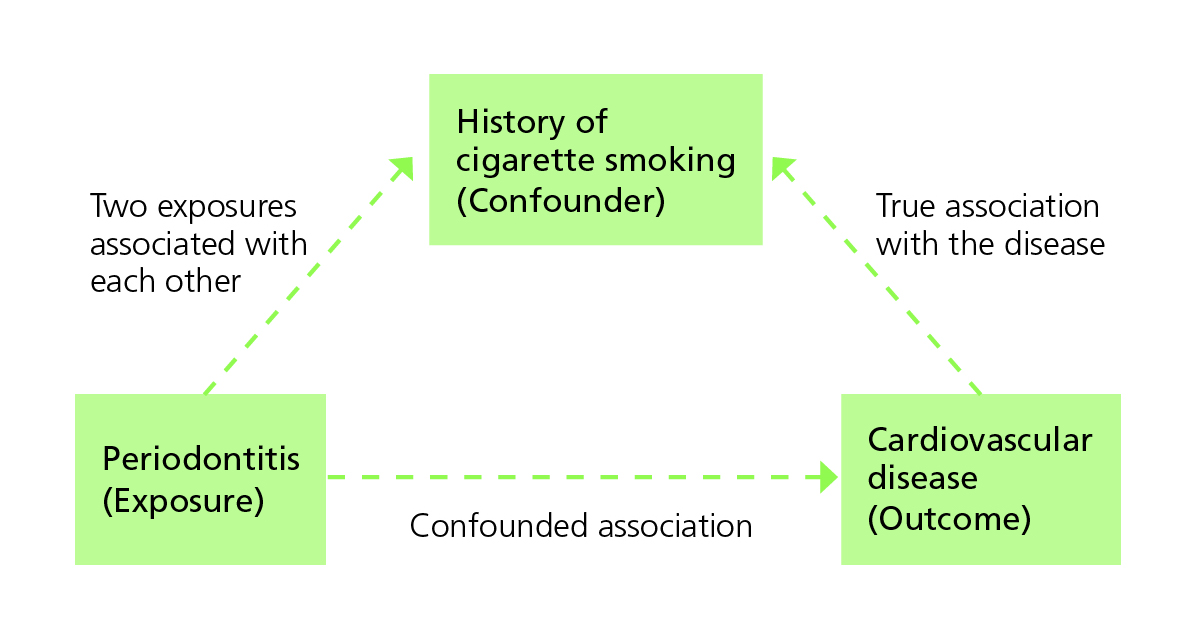
Counfounders
A confounder is an extraneous variable (not part of the purported chain of causality between exposure and outcome), often unobserved by the investigators, that distorts the relationship between exposure and the outcome of interest.
Confounding happens when the third variable is associated with the exposure while also being a potential cause of the outcome.